Helm 部署 kube-prometheus-stack
一、介绍
kube-prometheus-stack 是一个基于 Prometheus 生态的 Kubernetes 监控解决方案,通过集成 Prometheus、Grafana、Alertmanager 等工具,提供全面的监控能力。它通过 Helm Chart 提供了一键部署的方式,能够快速搭建完整的 Kubernetes 集群监控系统。
1. 主要功能和组件
Prometheus Operator:用于管理 Prometheus 实例的部署和配置,是整个监控系统的控制中心。
Prometheus Server:负责抓取和存储时间序列数据。
Alertmanager:用于处理告警,支持多种通知渠道(如邮件、Slack 等)。
Grafana:提供可视化仪表盘,用于展示监控数据。
Node Exporter:收集节点级别的指标(如 CPU、内存、磁盘等)。
kube-state-metrics:收集 Kubernetes 资源的指标数据。
Prometheus Adapter:将 Prometheus 的指标数据适配到 Kubernetes 的 Metrics API。
Thanos(可选):用于实现高可用和数据持久化。
二、部署
1. 拉取 helm repo
# 1. 添加 kubernetes-dashboard helm chart
[root@k8s-master01 kube-prometheus-stack]# helm repo add prometheus-community https://prometheus-community.github.io/helm-charts
# 2. 更新下仓库
[root@k8s-master01 kube-prometheus-stack]# helm repo update
# 3. 查询repo
[root@k8s-master01 kube-prometheus-stack]# helm repo list # 4. 下载对应版本的包
[root@k8s-master01 kube-prometheus-stack]# helm pull prometheus-community/kube-prometheus-stack --version=35.0.0如果失败的,可以使用我已经做好的helm报里面都有现成的
https://github.com/zhentianxiang/kube-prometheus-stack-prometheus
使用我的配置配置文件即可
修改配置文件中的 etcd 连接地址和证书地址:一定要修改为容器内的路径 /etc/prometheus/secrets/kube-etcd-client-certs/xxx
修改 storageclasses 的名称
修改 alertmanager 告警推送配置,邮箱信息,webhook信息之类的
2. 修改配置文件
# 1. 修改 value.yaml,可根据我上面GitHub中的进行参考
[root@k8s-master01 kube-prometheus-stack]# tar xvf kube-prometheus-stack
[root@k8s-master01 kube-prometheus-stack]# cd kube-prometheus-stack
[root@k8s-master01 kube-prometheus-stack]# vim value.yaml
# 2. 启动
# 配置 helm 命令补齐
# 当前 shell 窗口:
[root@k8s-master01 kube-prometheus-stack]# curl https://raw.githubusercontent.com/helm/helm/main/scripts/get-helm-3 | bash
[root@k8s-master01 kube-prometheus-stack]# source <(kubectl completion bash)
[root@k8s-master01 kube-prometheus-stack]# source <(helm completion bash)
# 永久:
[root@k8s-master01 kube-prometheus-stack]# echo "source <(kubectl completion bash)" >> ~/.bashrc
[root@k8s-master01 kube-prometheus-stack]# helm completion bash > /etc/bash_completion.d/helm
# 事先创建一个 kube-etcd 的 secret 以免由于修改 values.yaml 中 etcd 证书地址导致 helm 自动创建的时候与你本地的 etcd 证书对不上(修改为你 etcd 证书路径)
[root@k8s-master01 kube-prometheus-stack]# kubectl -n monitoring create secret generic kube-etcd-client-certs \
--from-file=etcd-client-ca.crt=/etc/etcd/ssl/ca.pem \
--from-file=etcd-client.crt=/etc/etcd/ssl/server.pem \
--from-file=etcd-client.key=/etc/etcd/ssl/server-key.pem
[root@k8s-master01 kube-prometheus-stack]# helm upgrade --install kube-prometheus-stack ./ -f values.yaml --namespace monitoring --create-namespace
[root@k8s-master01 kube-prometheus-stack]# kubectl -n monitoring get pod
NAME READY STATUS RESTARTS AGE
alertmanager-kube-prometheus-stack-alertmanager-0 2/2 Running 0 22m
alertmanager-kube-prometheus-stack-alertmanager-1 2/2 Running 0 22m
alertmanager-kube-prometheus-stack-alertmanager-2 2/2 Running 0 22m
kube-prometheus-stack-grafana-f85559cbf-qq8nv 3/3 Running 0 21m
kube-prometheus-stack-grafana-f85559cbf-qxj66 3/3 Running 0 21m
kube-prometheus-stack-grafana-f85559cbf-zdpgk 3/3 Running 0 34m
kube-prometheus-stack-kube-state-metrics-5d7ccc88bd-dl85v 1/1 Running 0 50m
kube-prometheus-stack-operator-7bbb85f6db-crss4 1/1 Running 0 160m
kube-prometheus-stack-prometheus-node-exporter-2zrxq 1/1 Running 0 160m
kube-prometheus-stack-prometheus-node-exporter-5j8ss 1/1 Running 0 160m
kube-prometheus-stack-prometheus-node-exporter-7kchl 1/1 Running 0 160m
kube-prometheus-stack-prometheus-node-exporter-9zr5f 1/1 Running 0 160m
kube-prometheus-stack-prometheus-node-exporter-fn29w 1/1 Running 0 160m
kube-prometheus-stack-prometheus-node-exporter-kjgzh 1/1 Running 0 160m
kube-prometheus-stack-prometheus-node-exporter-kv69t 1/1 Running 0 160m
kube-prometheus-stack-prometheus-node-exporter-rhkjj 1/1 Running 0 160m
kube-prometheus-stack-prometheus-node-exporter-w6j22 1/1 Running 0 160m
kube-prometheus-stack-prometheus-node-exporter-x7fdq 1/1 Running 0 160m
prometheus-kube-prometheus-stack-prometheus-0 2/2 Running 0 160m
prometheus-kube-prometheus-stack-prometheus-1 2/2 Running 0 160m
prometheus-kube-prometheus-stack-prometheus-2 2/2 Running 0 160m
# 获取 grafana 登录密码
[root@k8s-master01 kube-prometheus-stack]# kubectl -n monitoring get secrets kube-prometheus-stack-grafana -o jsonpath="{.data.admin-password}" | base64 --decode ; echo
prom-operator
# 查看 alertmanager 配置文件
[root@k8s-master01 kube-prometheus-stack]# kubectl get secrets -n monitoring alertmanager-kube-prometheus-stack-alertmanager-generated -o jsonpath="{.data.alertmanager\.yaml}"|base64 --decode至此 helm 方式部署 Prometheus 已完成
三、自定义告警规则
1. prometheus-rules 添加
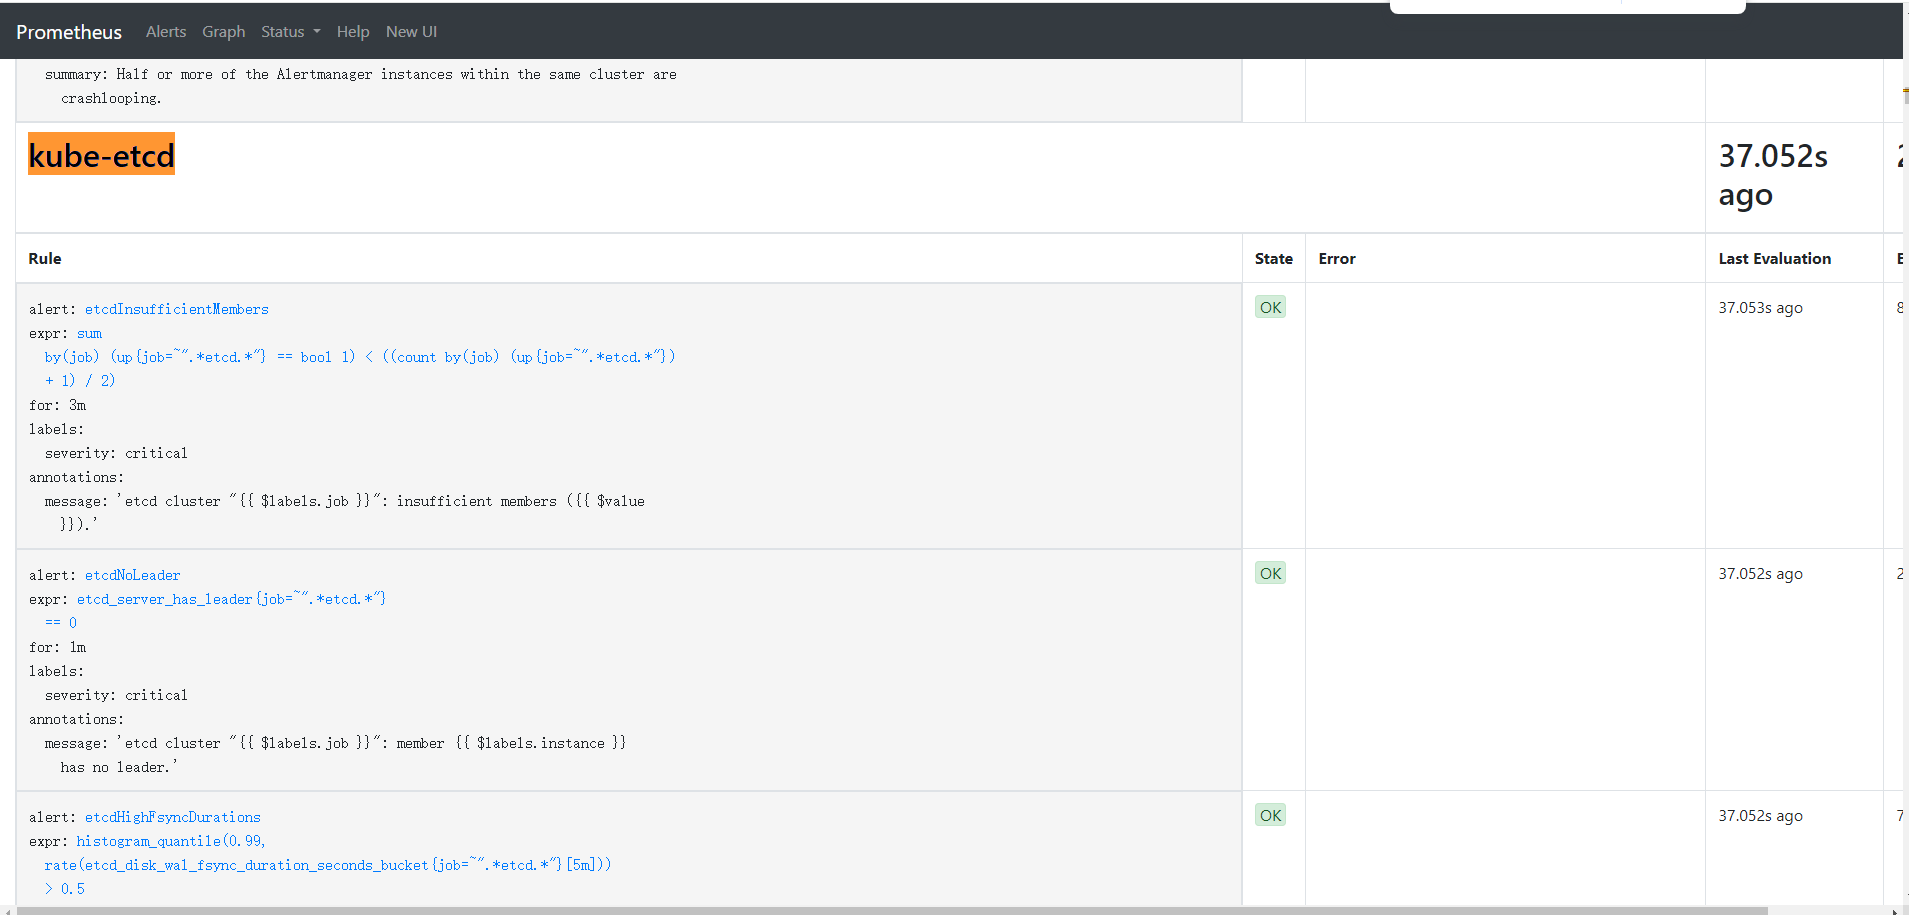
kube-prometheus-stack 默认安装好已经有 kube-etcd 的 servicemonitor了,所以不必再安装一次了,以下是教学
etcd 告警规则
[root@k8s-master1 prome-rules]# cat kube-prometheus-stack-etcd.yaml
apiVersion: monitoring.coreos.com/v1
kind: PrometheusRule
metadata:
  labels:
    app.kubernetes.io/name: kube-prometheus
    app.kubernetes.io/part-of: kube-prometheus
    prometheus: k8s
    role: alert-rules
    release: kube-prometheus-stack
  name: kube-prometheus-stack-etcd
  namespace: monitoring
spec:
  groups:
  - name: kube-etcd
    rules:
    - alert: "etcd 成员不足"
      annotations:
        message: 'etcd 集群 "": 成员数量不足()。'
      expr: |
        sum(up{job=~".*etcd.*"} == bool 1) by (job) < ((count(up{job=~".*etcd.*"}) by (job) + 1) / 2)
      for: 3m
      labels:
        gseverity: critical

    - alert: "etcd 无领导者"
      annotations:
        message: 'etcd 集群 "": 成员  无领导者。'
      expr: |
        etcd_server_has_leader{job=~".*etcd.*"} == 0
      for: 1m
      labels:
        gseverity: critical

    - alert: "etcd 高 fsync 持续时间"
      annotations:
        message: 'etcd 集群 "": 99百分位的fsync持续时间为 s(正常应小于10ms),etcd实例 。'
      expr: |
        histogram_quantile(0.99, rate(etcd_disk_wal_fsync_duration_seconds_bucket{job=~".*etcd.*"}[5m])) > 0.5
      for: 3m
      labels:
        gseverity: warning

    - alert: "etcd 高提交持续时间"
      annotations:
        message: 'etcd 集群 "": 99百分位的提交持续时间为 s(正常应小于120ms),etcd实例 。'
      expr: |
        histogram_quantile(0.99, rate(etcd_disk_backend_commit_duration_seconds_bucket{job=~".*etcd.*"}[5m])) > 0.25
      for: 3m
      labels:
        gseverity: warning

    - alert: "etcd 节点 RTT 持续时间过高"
      annotations:
        message: 'etcd 集群 "": 节点RTT持续时间为 s,etcd实例 。'
      expr: |
        histogram_quantile(0.99, rate(etcd_network_peer_round_trip_time_seconds_bucket[5m])) > 0.5
      for: 3m
      labels:
        gseverity: warning

    - alert: "etcd 磁盘空间不足"
      annotations:
        message: 'etcd 集群 "": etcd 实例 的磁盘空间不足。'
      expr: |
        node_filesystem_avail_bytes{job=~".*etcd.*", mountpoint="/"} / node_filesystem_size_bytes{job=~".*etcd.*", mountpoint="/"} < 0.1
      for: 5m
      labels:
        gseverity: critical

    - alert: "etcd 数据目录使用率过高"
      annotations:
        message: 'etcd 集群 "": 数据目录使用率超过 90% 的实例 。'
      expr: |
        etcd_debugging_mvcc_db_total_size_in_bytes{job=~".*etcd.*"} > 0.9 * node_filesystem_size_bytes{job=~".*etcd.*", mountpoint="/var/lib/etcd"}
      for: 5m
      labels:
        gseverity: warning

    - alert: "etcd Leader 频繁更换"
      annotations:
        message: 'etcd 集群 "": 领导者频繁更换,当前领导者为 。'
      expr: |
        increase(etcd_server_leader_changes_seen_total{job=~".*etcd.*"}[10m]) > 3
      for: 10m
      labels:
        gseverity: warning

    - alert: "etcd 同步数据失败"
      annotations:
        message: 'etcd 集群 "": etcd 实例 无法同步数据到其他节点。'
      expr: |
        rate(etcd_server_proposals_failed_total{job=~".*etcd.*"}[5m]) > 0
      for: 5m
      labels:
        gseverity: critical

    - alert: "etcd 存储碎片化"
      annotations:
        message: 'etcd 集群 "": etcd 实例 的存储碎片化过高,建议优化存储或重新压缩。'
      expr: |
        etcd_debugging_store_compaction_keys_total{job=~".*etcd.*"} > 10000
      for: 10m
      labels:
        gseverity: warning

    - alert: "etcd 网络延迟过高"
      annotations:
        message: 'etcd 集群 "": 节点间网络延迟过高,可能导致同步数据变慢。'
      expr: |
        histogram_quantile(0.99, rate(etcd_network_peer_round_trip_time_seconds_bucket[5m])) > 1
      for: 5m
      labels:
        gseverity: critical

[root@k8s-master01 etcd-service]# kubectl apply -f etcd-rules-monitoring.yaml
grafana 告警规则
[root@k8s-master1 prome-rules]# cat kube-prometheus-stack-grafana.yaml
apiVersion: monitoring.coreos.com/v1
kind: PrometheusRule
metadata:
  labels:
    app.kubernetes.io/name: kube-prometheus
    app.kubernetes.io/part-of: kube-prometheus
    prometheus: k8s
    role: alert-rules
    release: kube-prometheus-stack
  name: kube-prometheus-stack-grafana
  namespace: monitoring
spec:
  groups:
  - name: kube-grafana
    rules:
    - alert: GrafanaHTTP请求错误过多
      annotations:
        description: 'Grafana 的 HTTP 500 错误过多,可能存在服务异常。'
      expr: |
        sum(rate(grafana_http_request_total{status="500"}[5m])) > 5
      for: 5m
      labels:
        severity: critical
    - alert: Grafana内存使用过高
      annotations:
        description: 'Grafana 内存使用超过 90%,可能存在内存泄漏或高负载。'
      expr: |
        grafana_memstats_alloc_bytes / grafana_memstats_sys_bytes > 0.9
      for: 5m
      labels:
        severity: warning
    - alert: Grafana数据源查询时间过长
      annotations:
        description: 'Grafana 数据源查询时间超过正常范围,可能影响性能。'
      expr: |
        histogram_quantile(0.99, sum(rate(grafana_data_source_request_duration_seconds_bucket[5m])) by (le)) > 1
      for: 5m
      labels:
        severity: warning
    - alert: Grafana活跃用户过多
      annotations:
        description: 'Grafana 当前活跃用户数超过预期,可能导致系统负载增加。'
      expr: |
        grafana_active_users > 100
      for: 5m
      labels:
        severity: warning
修改完成后,Prometheus 会自动重载配置(如果不行手动重启一下),不需要重启 Pod,进入 Prometheus rules 界面即可看到新的规则
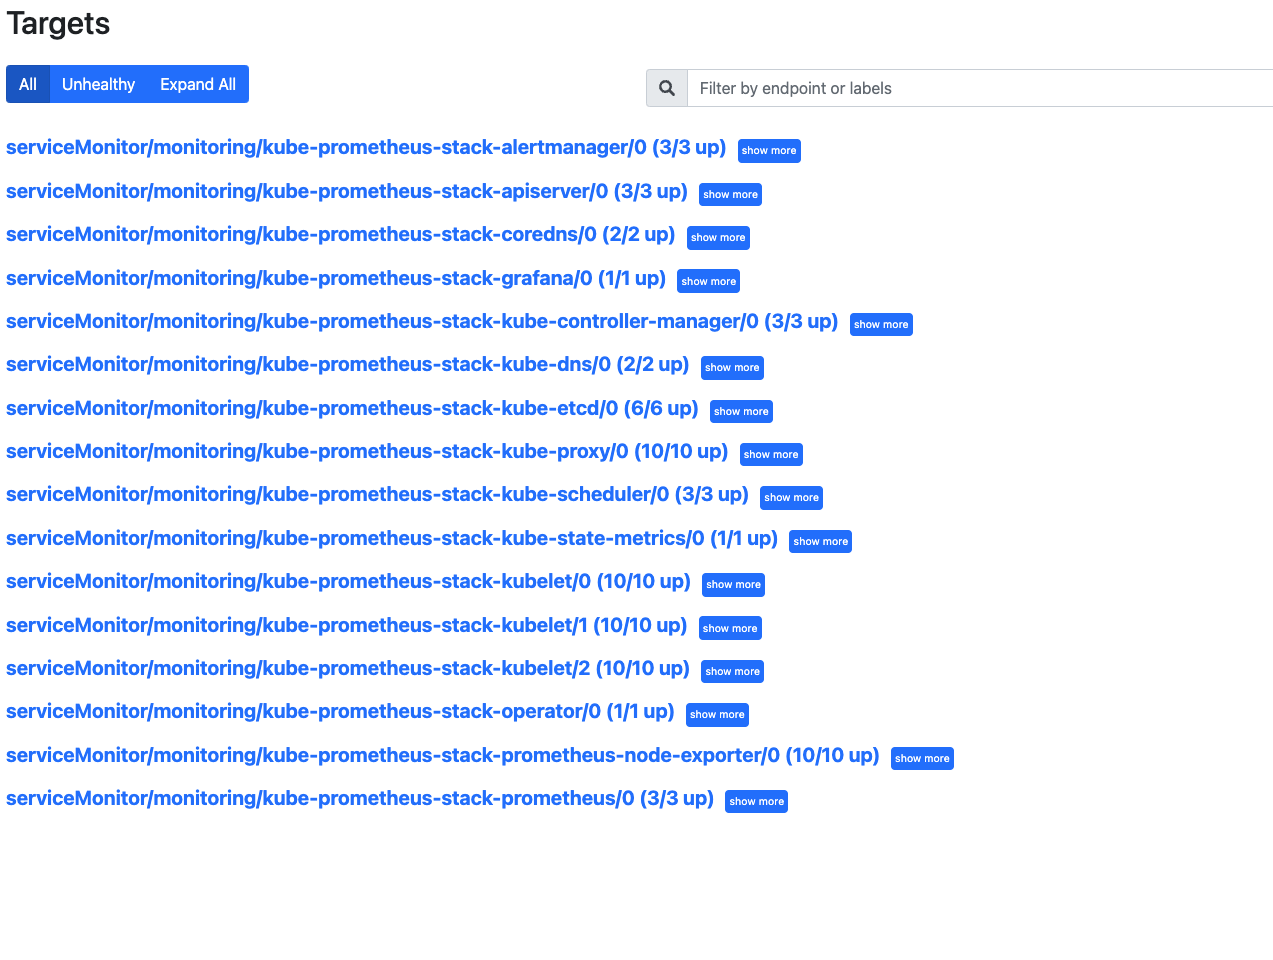
2. prome Targets 报红问题
[root@k8s-master01 etcd-service]# kubectl edit cm/kube-proxy -n kube-system

metricsBindAddress: "0.0.0.0"

[root@k8s-master01 etcd-service]# kubectl rollout restart daemonset -n kube-system kube-proxy

# 修改如下部位
[root@k8s-master1 kube-prometheus-stack]# vim values.yaml
kubeDns:
  enabled: true
  service:
    dnsmasq:
      port: 10053
      targetPort: 9153
    skydns:
      port: 10054
      targetPort: 9153
  serviceMonitor:
    interval: ""
    proxyUrl: ""
    metricRelabelings: []
    relabelings: []
    dnsmasqMetricRelabelings: []
    dnsmasqRelabelings: []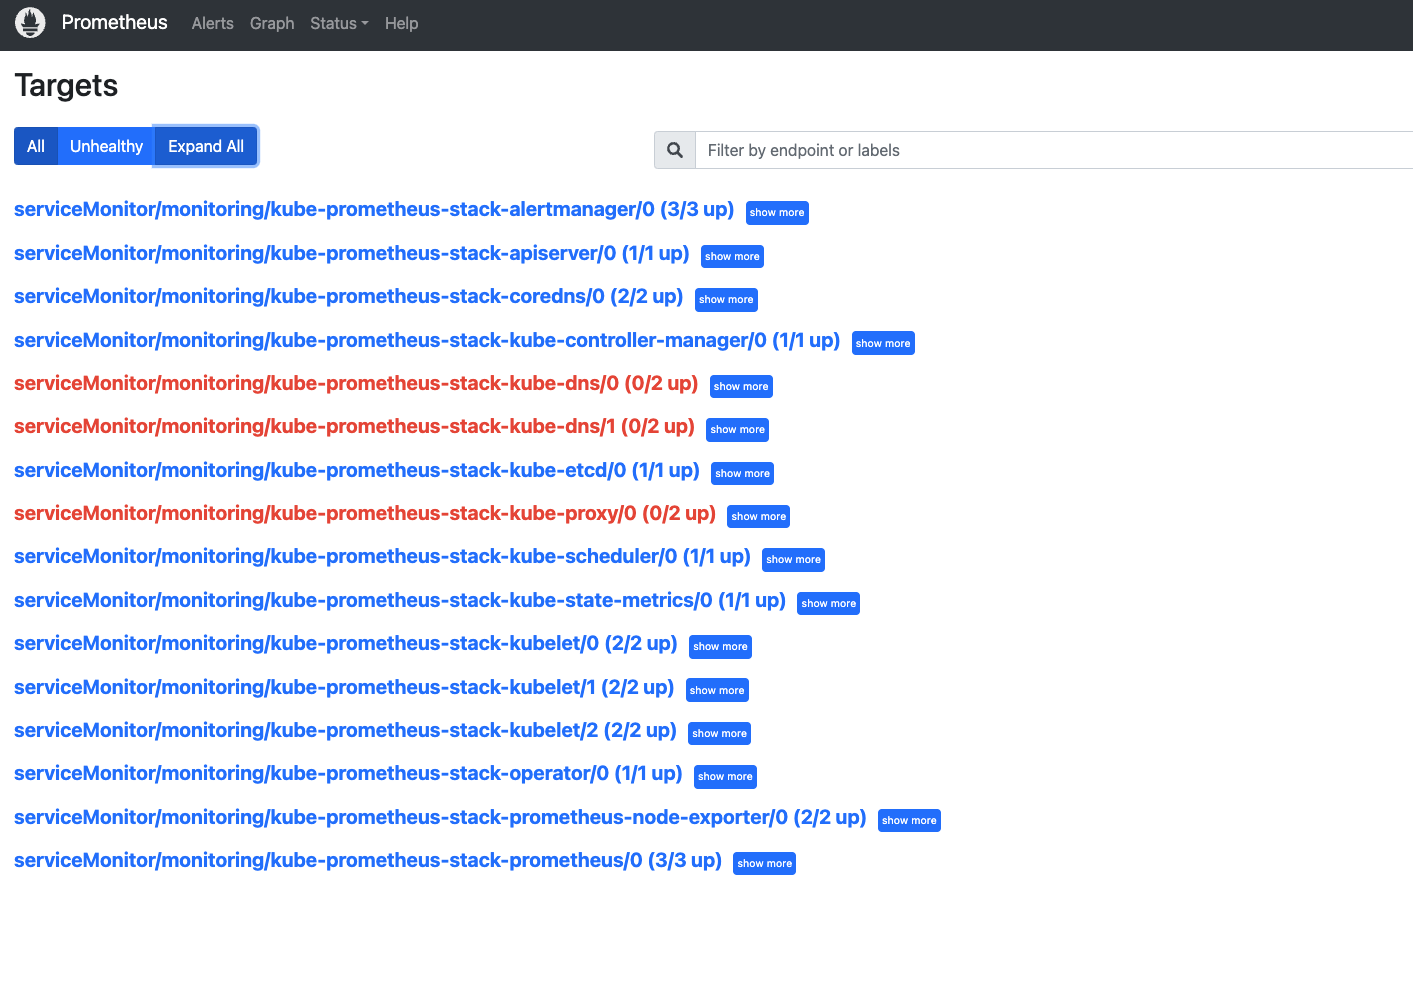
四、配置 webhook 消息推送
1. 安装 prometheus-alert
alertmanager 是告警处理模块,但是告警消息的发送方法并不丰富。如果需要将告警接入飞书,钉钉,微信等,还需要有相应的SDK适配。prometheusAlert就是这样的SDK,可以将告警消息发送到各种终端上。 prometheus Alert 是开源的运维告警中心消息转发系统,支持主流的监控系统 prometheus,日志系统 Graylog 和数据可视化系统 Grafana 发出的预警消息。通知渠道支持钉钉、微信、华为云短信、腾讯云短信、腾讯云电话、阿里云短信、阿里云电话等。
创建飞书机器人
准备配置文件
启动 prometheusAlert服务
对接告警服务
调试告警模板
参数解释:

PA_LOGIN_USER=alertuser 登录账号
PA_LOGIN_PASSWORD=123456 登录密码
PA_TITLE=prometheusAlert 系统title
PA_OPEN_FEISHU=1 开启飞书支持
PA_OPEN_DINGDING=1 开启钉钉支持
PA_OPEN_WEIXIN=1 开启微信支持
[root@k8s-master1 webhook]# cat webhook-deploy.yaml
apiVersion: apps/v1
kind: Deployment
metadata:
name: webhook-deploy
namespace: monitoring
spec:
replicas: 1
selector:
matchLabels:
k8s-app: webhook
strategy:
type: Recreate
template:
metadata:
creationTimestamp: null
labels:
k8s-app: webhook
spec:
containers:
- env:
- name: PA_LOGIN_USER
value: alertuser
- name: PA_LOGIN_PASSWORD
value: "123456"
- name: PA_TITLE
value: prometheusAlert
- name: PA_OPEN_FEISHU
value: "1"
- name: PA_OPEN_DINGDING
value: "0"
- name: PA_OPEN_WEIXIN
value: "0"
image: registry.cn-hangzhou.aliyuncs.com/tianxiang_app/prometheus-alert:latest
imagePullPolicy: IfNotPresent
name: webhook
ports:
- containerPort: 8080
protocol: TCP
resources: {}
terminationMessagePath: /dev/termination-log
terminationMessagePolicy: File
volumeMounts:
- mountPath: /app/db
name: db-data
dnsPolicy: ClusterFirst
restartPolicy: Always
schedulerName: default-scheduler
securityContext: {}
terminationGracePeriodSeconds: 30
volumes:
- name: db-data
persistentVolumeClaim:
claimName: webkook-db-data[root@k8s-master1 webhook]# cat webhook-pvc.yaml
apiVersion: v1
kind: PersistentVolumeClaim
metadata:
name: webkook-db-data
namespace: monitoring
annotations:
volume.beta.kubernetes.io/storage-class: "nfs-provisioner-storage"
spec:
accessModes:
- ReadWriteOnce
resources:
requests:
storage: 10Gi
[root@k8s-master1 alert-webhook]# cat webhook-service.yaml
apiVersion: v1
kind: Service
metadata:
  name: webhook-service
  namespace: monitoring
spec:
  ports:
  - nodePort: 31330
    port: 8080
    protocol: TCP
    targetPort: 8080
  selector:
    k8s-app: webhook
  type: NodePort
[root@k8s-master1 alert-webhook]# kubectl apply -f .
[root@k8s-master1 alert-webhook]# kubectl -n monitoring get svc
2. 告警通知模版
浏览器打开并进行配置
{{ $alertmanagerURL := "http://192.168.10.1:32093" -}}
{{ $alerts := .alerts -}}
{{ $grafanaURL := "http://192.168.10.1:32030/d/HmKjz4pHk/kubernetesji-qun-jian-kong-mian-ban?orgId=1&refresh=5s" -}}
{{ range $alert := $alerts -}}
  {{ $groupKey := printf "%s|%s" $alert.labels.alertname $alert.status -}}
  {{ $urimsg := "" -}}
  {{ range $key,$value := $alert.labels -}}
    {{ $urimsg = print $urimsg $key "%3D%22" $value "%22%2C" -}}
  {{ end -}}

  {{ if eq $alert.status "resolved" -}}
🟢 Kubernetes 集群恢复通知 🟢
  {{ else -}}
🚨 Kubernetes 集群告警通知 🚨
  {{ end -}}

---

🔔 **告警名称**: {{ $alert.labels.alertname }}

🚩 **告警级别**: {{ $alert.labels.severity }}

{{ if eq $alert.status "resolved" }}✅ **告警状态**: {{ $alert.status }}{{ else }}🔥 **告警状态**: {{ $alert.status }}{{ end }}

🕒 **开始时间**: {{ GetCSTtime $alert.startsAt }}
{{ if eq $alert.status "resolved" }}#### 🕒 **结束时间**: {{ GetCSTtime $alert.endsAt }}{{ end }}

---

📌 **告警详情**

- **🏷️ 命名空间**: {{ $alert.labels.namespace }}
- **📡 实例名称**: {{ $alert.labels.pod }}
- **🌐 实例地址**: {{ $alert.labels.pod_ip }}
- **🖥️ 实例节点**: {{ $alert.labels.node }}
- **🔄 实例控制器类型**: {{ $alert.labels.owner_kind }}
- **🔧 实例控制器名称**: {{ $alert.labels.owner_name }}

---

📝 **告警描述**

{{ $alert.annotations.message }}{{ $alert.annotations.summary }}{{ $alert.annotations.description }}

---

🚀 **快速操作**

- **[点我屏蔽该告警]({{ $alertmanagerURL }}/#/silences/new?filter=%7B{{ SplitString $urimsg 0 -3 }}%7D)**
- **[点击我查看 Grafana 监控面板]({{ $grafanaURL }})**

---

📊 **建议操作**

1. 检查 Pod 日志,确认是否有异常。
2. 检查节点 {{ $alert.labels.node }} 的资源使用情况,确保没有资源瓶颈。
3. 如果问题持续,考虑重启 Pod 或节点。

---

📅 **告警时间线**

- **首次触发**: {{ GetCSTtime $alert.startsAt }}
{{ if eq $alert.status "resolved" }}
- **结束时间**: {{ GetCSTtime $alert.endsAt }}
{{ end }}

---

📞 **联系支持**

如有疑问,请联系 Kubernetes 运维团队或查看相关文档。

---

{{ if eq $alert.status "resolved" }}
**✅ 告警已恢复,请确认业务正常运行!**
{{ else }}
**🔔 请及时处理,避免影响业务正常运行!**
{{ end }}

---

{{ end -}}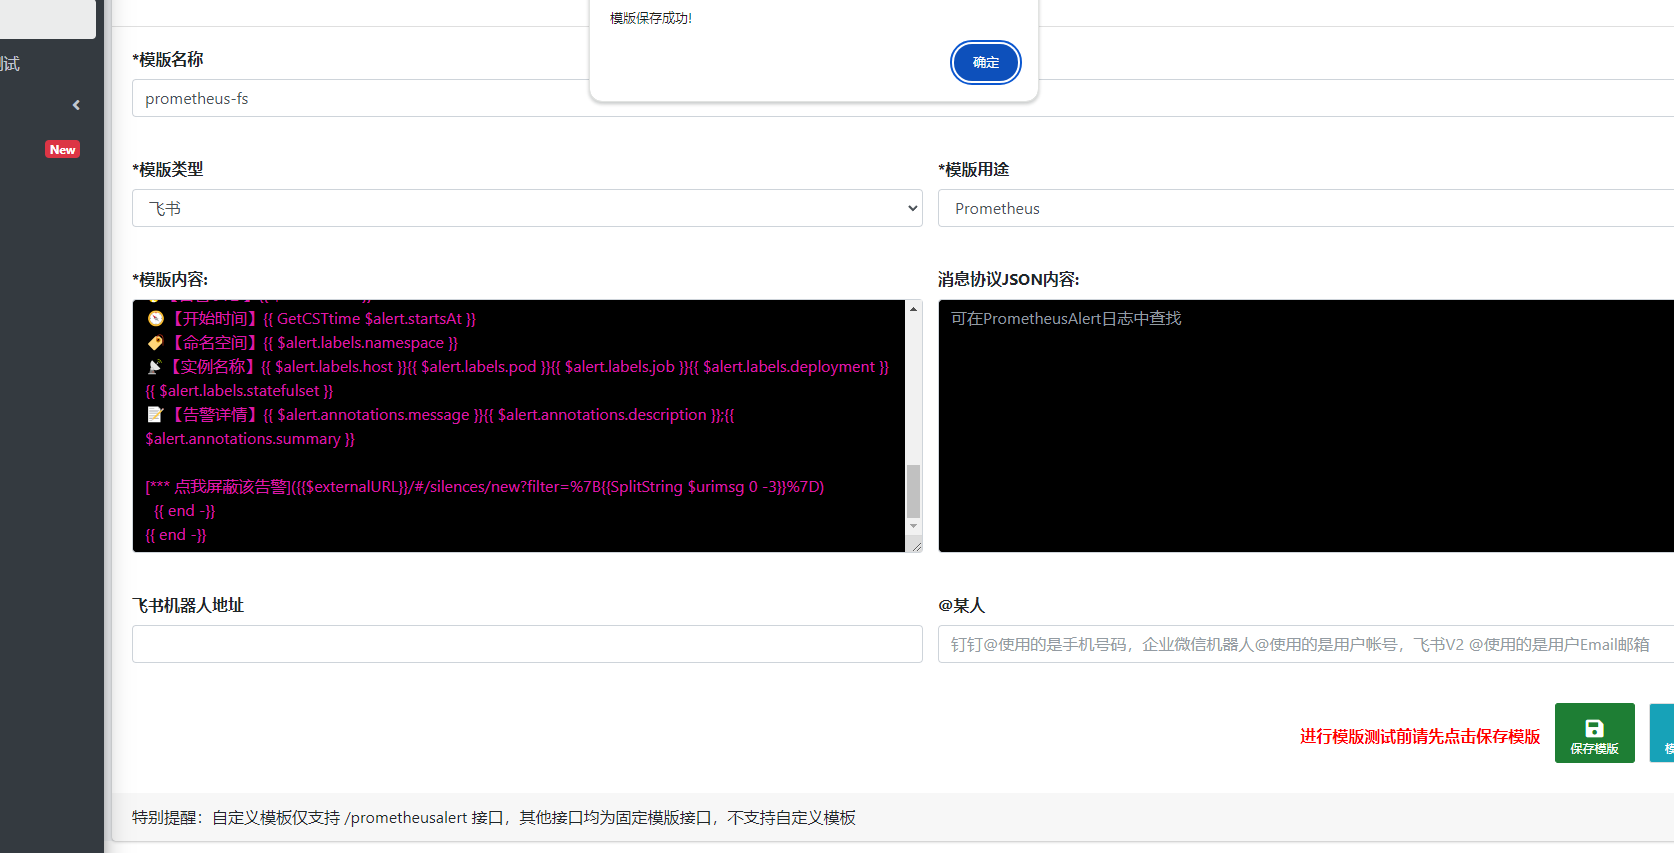
五、Mysql-Exporter
MySQL Exporter是一个开源工具,用于监控MySQL服务器的性能。 它通过收集MySQL服务器的状态信息,并将其以Prometheus可理解的格式导出,使得管理员可以利用Prometheus或其他监控系统进行数据分析和可视化。
首先在 mysql 上面创建一个 exporter 用户,专门用来提供监控来使用,这里我就使用 exporter 用户了
# 创建用户
CREATE USER 'exporter'@'%' IDENTIFIED WITH mysql_native_password BY '123456';
GRANT ALL PRIVILEGES ON *.* TO 'exporter'@'%' WITH GRANT OPTION;
[root@k8s-master1 mysql-export]# cat deployment.yaml
apiVersion: v1
kind: ConfigMap
metadata:
name: mysqld-exporter-222
namespace: monitoring
data:
.mysqld_exporter.cnf: |
[client]
user=exporter
password=123456
host=192.168.233.222
---
apiVersion: apps/v1
kind: Deployment
metadata:
name: mysqld-exporter-222
namespace: monitoring
labels:
app: mysqld-exporter # 统一的标签
spec:
replicas: 1
selector:
matchLabels:
app: mysqld-exporter
instance: mysqld-exporter-222 # 用于区分实例
template:
metadata:
labels:
app: mysqld-exporter # 统一的标签
instance: mysqld-exporter-222 # 唯一标识实例
spec:
containers:
- name: mysqld-exporter
image: prom/mysqld-exporter
args:
- --config.my-cnf=/etc/.mysqld_exporter.cnf
- --collect.info_schema.tables
- --collect.info_schema.innodb_tablespaces
- --collect.info_schema.innodb_metrics
- --collect.global_status
- --collect.global_variables
- --collect.slave_status
- --collect.info_schema.processlist
- --collect.perf_schema.tablelocks
- --collect.perf_schema.eventsstatements
- --collect.perf_schema.eventsstatementssum
- --collect.perf_schema.eventswaits
- --collect.auto_increment.columns
- --collect.binlog_size
- --collect.perf_schema.tableiowaits
- --collect.perf_schema.indexiowaits
- --collect.info_schema.userstats
- --collect.info_schema.clientstats
- --collect.info_schema.tablestats
- --collect.info_schema.schemastats
- --collect.perf_schema.file_events
- --collect.perf_schema.file_instances
- --collect.perf_schema.replication_group_member_stats
- --collect.perf_schema.replication_applier_status_by_worker
- --collect.slave_hosts
- --collect.info_schema.innodb_cmp
- --collect.info_schema.innodb_cmpmem
- --collect.info_schema.query_response_time
- --collect.engine_tokudb_status
- --collect.engine_innodb_status
ports:
- containerPort: 9104
protocol: TCP
volumeMounts:
- name: mysqld-exporter-222
mountPath: /etc/.mysqld_exporter.cnf
subPath: .mysqld_exporter.cnf
volumes:
- name: mysqld-exporter-222
configMap:
name: mysqld-exporter-222
---
apiVersion: v1
kind: Service
metadata:
name: mysqld-exporter-222
namespace: monitoring
labels:
app: mysqld-exporter # 统一的标签
instance: mysqld-exporter-222 # 唯一标识实例
spec:
type: ClusterIP
ports:
- port: 9104
protocol: TCP
name: http
selector:
app: mysqld-exporter
instance: mysqld-exporter-222 # 匹配 Deployment 的标签[root@k8s-master1 mysql-export]# cat service-monitor.yaml
apiVersion: monitoring.coreos.com/v1
kind: ServiceMonitor
metadata:
name: mysqld-exporter
namespace: monitoring
labels:
release: kube-prometheus-stack # 确保与 Prometheus 的配置匹配
spec:
selector:
matchLabels:
app: mysqld-exporter # 匹配 mysqld-exporter 服务
namespaceSelector:
matchNames:
- monitoring
endpoints:
- port: http
interval: 15s
path: /metrics
relabelings:
- sourceLabels: [__meta_kubernetes_service_label_instance]
targetLabel: instance # 将 `instance` 标签值加入 Prometheus 指标[root@k8s-master1 mysql-export]# cat rules.yaml
apiVersion: monitoring.coreos.com/v1
kind: PrometheusRule
metadata:
labels:
app.kubernetes.io/name: kube-prometheus
app.kubernetes.io/part-of: kube-prometheus
prometheus: k8s
role: alert-rules
release: kube-prometheus-stack
name: mysql-exporter
namespace: monitoring
spec:
groups:
- name: mysql-exporter
rules:
- alert: MysqlDown
expr: mysql_up == 0
for: 0m
labels:
severity: critical
annotations:
summary: MySQL 实例不可用 (实例 )
description: "MySQL 实例在 不可用。\n 当前值 = \n 标签 = "
- alert: MysqlTooManyConnections(>80%)
expr: max_over_time(mysql_global_status_threads_connected[1m]) / mysql_global_variables_max_connections * 100 > 80
for: 2m
labels:
severity: warning
annotations:
summary: MySQL 连接数过多 (> 80%) (实例 )
description: "MySQL 实例 的连接数超过 80%。\n 当前值 = \n 标签 = "
- alert: MysqlHighPreparedStatementsUtilization(>80%)
expr: max_over_time(mysql_global_status_prepared_stmt_count[1m]) / mysql_global_variables_max_prepared_stmt_count * 100 > 80
for: 2m
labels:
severity: warning
annotations:
summary: MySQL 预处理语句使用率过高 (> 80%) (实例 )
description: "MySQL 实例 的预处理语句使用率超过 80%。\n 当前值 = \n 标签 = "
- alert: MysqlHighThreadsRunning
expr: max_over_time(mysql_global_status_threads_running[1m]) / mysql_global_variables_max_connections * 100 > 60
for: 2m
labels:
severity: warning
annotations:
summary: MySQL 活跃线程过多 (实例 )
description: "MySQL 实例 的活跃线程超过 60%。\n 当前值 = \n 标签 = "
- alert: MysqlSlaveIoThreadNotRunning
expr: ( mysql_slave_status_slave_io_running and ON (instance) mysql_slave_status_master_server_id > 0 ) == 0
for: 0m
labels:
severity: critical
annotations:
summary: MySQL 从库 IO 线程未运行 (实例 )
description: "MySQL 从库的 IO 线程在 未运行。\n 当前值 = \n 标签 = "
- alert: MysqlSlaveSqlThreadNotRunning
expr: ( mysql_slave_status_slave_sql_running and ON (instance) mysql_slave_status_master_server_id > 0) == 0
for: 0m
labels:
severity: critical
annotations:
summary: MySQL 从库 SQL 线程未运行 (实例 )
description: "MySQL 从库的 SQL 线程在 未运行。\n 当前值 = \n 标签 = "
- alert: MysqlSlaveReplicationLag
expr: ( (mysql_slave_status_seconds_behind_master - mysql_slave_status_sql_delay) and ON (instance) mysql_slave_status_master_server_id > 0 ) > 30
for: 1m
labels:
severity: critical
annotations:
summary: MySQL 从库复制延迟过大 (实例 )
description: "MySQL 实例 的复制延迟超过 30 秒。\n 当前值 = \n 标签 = "
- alert: MysqlSlowQueries
expr: increase(mysql_global_status_slow_queries[1m]) > 0
for: 2m
labels:
severity: warning
annotations:
summary: MySQL 慢查询 (实例 )
description: "MySQL 实例 发生新的慢查询。\n 当前值 = \n 标签 = "
- alert: MysqlInnodbLogWaits
expr: rate(mysql_global_status_innodb_log_waits[15m]) > 10
for: 0m
labels:
severity: warning
annotations:
summary: MySQL InnoDB 日志等待过多 (实例 )
description: "MySQL 实例 的 InnoDB 日志写入出现卡顿。\n 当前值 = \n 标签 = "
- alert: MysqlRestarted
expr: mysql_global_status_uptime < 60
for: 0m
labels:
severity: info
annotations:
summary: MySQL 刚刚重启 (实例 )
description: "MySQL 实例 在一分钟内刚刚重启。\n 当前值 = \n 标签 = "六、配置 blackbox-exporter
blackbox-exporter是Prometheus官方提供的一个黑盒监控解决方案,可以通过HTTP、HTTPS、DNS、ICMP、TCP和gRPC方式对目标实例进行检测。可用于以下使用场景:
HTTP/HTTPS:URL/API可用性检测
ICMP:主机存活检测
TCP:端口存活检测
DNS:域名解析
黑盒监控和白盒监控:
黑盒监控,关注的是实时状态,一般都是正在发生的事件,比如网站访问不了、磁盘无法写入数据等。即黑盒监控的重点是能对正在发生的故障进行告警。常见的黑盒监控包括HTTP探针、TCP探针等用于检测站点或者服务的可访问性,以及访问效率等。
白盒监控,关注的是原因,也就是系统内部的一些运行指标数据,例如nginx响应时长、存储I/O负载等
监控系统要能够有效的支持百盒监控和黑盒监控,通过白盒能够了解系统内部的实际运行状态,以及对监控指标的观察能够预判出可能出现的潜在问题,从而对潜在的不确定因素进行提前处理避免问题发生;而通过黑盒监控,可以在系统或服务发生故障时快速通知相关人员进行处理。
1.准备资源文件
资源文件可以从这里下载:https://github.com/prometheus-operator/kube-prometheus/tree/release-0.11/manifests
或者我上面提到的GitHub连接那个项目里面也有
$ ls -lh
total 36K
-rw-r--r-- 1 root root  485 Oct 26 00:43 blackboxExporter-clusterRoleBinding.yaml
-rw-r--r-- 1 root root  287 Oct 26 00:43 blackboxExporter-clusterRole.yaml
-rw-r--r-- 1 root root 2.1K Oct 28 09:53 blackboxExporter-configuration.yaml # 二次修改
-rw-r--r-- 1 root root 3.8K Oct 28 11:21 blackboxExporter-deployment.yaml
-rw-r--r-- 1 root root  422 Oct 28 11:24 blackboxExporter-ingress.yaml  # 自己配置的
-rw-r--r-- 1 root root  722 Oct 26 00:44 blackboxExporter-networkPolicy.yaml
-rw-r--r-- 1 root root  315 Oct 26 00:45 blackboxExporter-serviceAccount.yaml
-rw-r--r-- 1 root root  762 Oct 26 00:52 blackboxExporter-serviceMonitor.yaml  # 二次修改
-rw-r--r-- 1 root root  558 Oct 28 11:09 blackboxExporter-service.yaml
$ cat blackboxExporter-serviceMonitor.yaml
kind: ServiceMonitor
metadata:
  labels:
    app.kubernetes.io/component: exporter
    app.kubernetes.io/name: blackbox-exporter
    app.kubernetes.io/part-of: kube-prometheus
    app.kubernetes.io/version: 0.21.0
    release: kube-prometheus-stack  # prometheus 通过该标签来加载 Monitor
  name: blackbox-exporter
  namespace: monitoring
spec:
  endpoints:
  - bearerTokenFile: /var/run/secrets/kubernetes.io/serviceaccount/token
    interval: 30s
    path: /metrics
    port: https
    scheme: https
    tlsConfig:
      insecureSkipVerify: true
  selector:
    matchLabels:
      app.kubernetes.io/component: exporter
      app.kubernetes.io/name: blackbox-exporter
      app.kubernetes.io/part-of: kube-prometheus
$ cat blackboxExporter-configuration.yaml
apiVersion: v1
data:
  config.yml: |-
    "modules":
      "http_2xx":
        "http":
          "preferred_ip_protocol": "ip4"
          "valid_status_codes": [200]
          "valid_http_versions": ["HTTP/1.1", "HTTP/2.0"]
          "method": "GET"
          "follow_redirects": true                             # 允许301,302跳转重定向,
        "prober": "http"
      "http_post_2xx":
        "http":
          "method": "POST"
          "preferred_ip_protocol": "ip4"
        "prober": "http"
      "irc_banner":
        "prober": "tcp"
        "tcp":
          "preferred_ip_protocol": "ip4"
          "query_response":
          - "send": "NICK prober"
          - "send": "USER prober prober prober :prober"
          - "expect": "PING :([^ ]+)"
            "send": "PONG ${1}"
          - "expect": "^:[^ ]+ 001"
      "pop3s_banner":
        "prober": "tcp"
        "tcp":
          "preferred_ip_protocol": "ip4"
          "query_response":
          - "expect": "^+OK"
          "tls": true
          "tls_config":
            "insecure_skip_verify": false
      "ssh_banner":
        "prober": "tcp"
        "tcp":
          "preferred_ip_protocol": "ip4"
          "query_response":
          - "expect": "^SSH-2.0-"
      "tcp_connect":
        "prober": "tcp"
        "tcp":
          "preferred_ip_protocol": "ip4"
      "ping":
        "prober": "icmp"
        "timeout": "5s"
        "icmp":
          "preferred_ip_protocol": "ip4"
      "dns":                                                  # DNS 检测模块
        "prober": "dns"
        "dns":
          "transport_protocol": "udp"                         # 默认是 udp,tcp
          "preferred_ip_protocol": "ip4"  # 默认是 ip6
          "query_name": "kubernetes.default.svc.cluster.local"  # 利用这个域名来检查dns服务器
kind: ConfigMap
metadata:
  labels:
    app.kubernetes.io/component: exporter
    app.kubernetes.io/name: blackbox-exporter
    app.kubernetes.io/part-of: kube-prometheus
    app.kubernetes.io/version: 0.21.0
  name: blackbox-exporter-configuration
  namespace: monitoring
$ cat blackboxExporter-ingress.yaml
$ kubectl apply -f .
2. 测试验证功能性
1. 创建一个用于检测网站 HTTP 服务是否正常的服务
$ mkdir test/probe-kind/
$ cat test/probe-kind/blackbox-domain.yaml
apiVersion: monitoring.coreos.com/v1
kind: Probe
metadata:
  name: domain-probe
  namespace: monitoring
  labels:
    release: kube-prometheus-stack  # prometheus 通过该标签来加载 Monitor
spec:
  jobName: domain-probe # 任务名称
  prober: # 指定blackbox的地址
    url: blackbox-exporter.monitoring:19115
  module: http_2xx # 配置文件中的检测模块
  targets: # 目标(可以是static配置也可以是ingress配置)
    # ingress <Object>
    staticConfig:             # 如果配置了 ingress,静态配置优先
      static:
        - www.baidu.com
        - www.qq.com
2. 创建一个用于检测主机是否能够正常通信的服务(ping 检查)
$ cat test/probe-kind/blackbox-ping.yaml
apiVersion: monitoring.coreos.com/v1
kind: Probe
metadata:
  name: blackbox-ping
  namespace: monitoring
  labels:
    release: kube-prometheus-stack  # prometheus 通过该标签来加载 Monitor
spec:
  jobName: blackbox-ping
  interval: 10s
  module: ping
  prober:                        # 指定blackbox的地址
    url: blackbox-exporter.monitoring:19115 # blackbox-exporter 的 地址 和 http端口
    path: /probe                 # 路径
  targets:
    staticConfig:
      static:
      - blackbox-exporter.monitoring   # 要检测的 url
3. 创建一个用于检查 dns 服务是否正常的服务
$ cat test/probe-kind/blackbox-kubedns.yaml
apiVersion: monitoring.coreos.com/v1
kind: Probe
metadata:
  name: blackbox-coredns
  namespace: monitoring
  labels:
    release: kube-prometheus-stack  # prometheus 通过该标签来加载 Monitor
spec:
  jobName: blackbox-coredns
  interval: 10s
  module: dns
  prober:                        # 指定blackbox的地址
    url: blackbox-exporter.monitoring:19115 # blackbox-exporter 的 地址 和 http端口
    path: /probe                 # 路径
  targets:
    staticConfig:
      static:
      - kube-dns.kube-system:53   # 要检测的 url
4. 配置prometheus自动发现ingress资源并监控
$ cat test/probe-kind/blackbox-ingress.yaml
apiVersion: monitoring.coreos.com/v1
kind: Probe
metadata:
  name: blackbox-ingress
  namespace: monitoring
  labels:
    release: kube-prometheus-stack  # prometheus 通过该标签来加载 Monitor
spec:
  jobName: blackbox-ingress
  prober:
    url: blackbox-exporter.monitoring:19115
    path: /probe
  module: http_2xx
  targets:
    ingress:
      namespaceSelector:
        # 监测所有 namespace
        any: true
        # 只监测指定 namespace 的 ingress
        #matchNames:
        #- default
        #- monitoring
      # 只监测配置了标签 prometheus.io/http-probe: true 的 ingress
      selector:
        matchLabels:
          prometheus.io/http-probe: "true"
       # 只监测配置了注解 prometheus.io/http_probe: true 的 ingress
      #relabelingConfigs:
      #- action: keep
      #  sourceLabels:
      #  - __meta_kubernetes_ingress_annotation_prometheus_io_http_probe
      #- sourceLabels:
      #  - "__meta_kubernetes_ingress_scheme"
      #  - "__meta_kubernetes_ingress_host"
      #  - "__meta_kubernetes_ingress_annotation_prometheus_io_http_probe_port"
      #  - "__meta_kubernetes_ingress_path"
      #  regex: "true"
5. 配置prometheus自动发现service资源并监控
$ cat test/servicemonitor/blackbox-service.yaml
apiVersion: monitoring.coreos.com/v1
kind: ServiceMonitor
metadata:
  name: blackbox-service
  namespace: monitoring  # ServiceMonitor的命名空间
  labels:
    release: kube-prometheus-stack  # Prometheus Operator的release名称
spec:
  selector:
    matchExpressions:
      - { key: prometheus.io/http-probe, operator: In, values: ["true"] }
    matchLabels:
      release: kube-prometheus-stack
  endpoints:
    - interval: 30s
      path: /probe
      params:
        module:
        - http_2xx
      relabelings:
      - sourceLabels: [__meta_kubernetes_service_annotation_prometheus_io_http_probe]
        action: keep
        regex: "true"
      - sourceLabels:
        - "__meta_kubernetes_service_name"
        - "__meta_kubernetes_namespace"
        - "__meta_kubernetes_service_annotation_prometheus_io_http_probe_port"
        - "__meta_kubernetes_service_annotation_prometheus_io_http_probe_path"
        targetLabel: __param_target
        regex: (.+);(.+);(.+);(.+)
        replacement: $1.$2:$3$4
      - targetLabel: __address__
        replacement: blackbox-exporter.monitoring:19115
      - sourceLabels: [__param_target]
        targetLabel: instance
      - action: labelmap
        regex: __meta_kubernetes_service_label_(.+)
      - sourceLabels: [__meta_kubernetes_namespace]
        targetLabel: serivce_namespace
      - sourceLabels: [__meta_kubernetes_service_name]
        targetLabel: service_name
  namespaceSelector:
    any: true  # 监控所有命名空间
  selector:
    matchLabels:
      app: flask-app
6. 准备测试资源
$ cat test/web.yaml
apiVersion: apps/v1
kind: Deployment
metadata:
  name: appv1
  labels:
    app: appv1
spec:
  selector:
    matchLabels:
      app: appv1
  template:
    metadata:
      labels:
        app: appv1
    spec:
      containers:
      - image: nginx:alpine
        name: appv1
        command: ["/bin/sh", "-c", "echo '你好, 这是(王先森)APP-v1服务中心'>/usr/share/nginx/html/index.html;nginx -g 'daemon off;'"]
        ports:
        - containerPort: 80
          name: portv1
---
apiVersion: v1
kind: Service
metadata:
  name: appv1
  labels:
    app: appv1
  annotations: # 添加注解使其 blackbox-service 能够引用该资源
    prometheus.io/http-probe: "true"           # 控制是否监测
    prometheus.io/http-probe-path: /           # 控制监测路径
    prometheus.io/http-probe-port: "80"        # 控制监测端口
spec:
  selector:
    app: appv1
  ports:
    - name: http
      port: 80
      targetPort: portv1
---
kind: Deployment
apiVersion: apps/v1
metadata:
  name: whoami
  labels:
    app: whoami
spec:
  replicas: 1
  selector:
    matchLabels:
      app: whoami
  template:
    metadata:
      labels:
        app: whoami
    spec:
      containers:
        - name: whoami
          image: containous/whoami
          ports:
            - name: web
              containerPort: 80
---
apiVersion: v1
kind: Service
metadata:
  name: whoami
spec:
  ports:
    - protocol: TCP
      name: web
      port: 80
  selector:
    app: whoami
---
apiVersion: networking.k8s.io/v1
kind: Ingress
metadata:
  name: demo-web
  namespace: default
  labels:
    prometheus.io/http-probe: "true" # 添加标签用于 blacbox-ingress 自动发现监测
    release: kube-prometheus-stack  # Prometheus Operator的release名称,使其prometheus自动发现该ingress
spec:
  ingressClassName: nginx
  rules:
  - host: whoami.od.com
    http:
      paths:
      - pathType: Prefix
        path: /
        backend:
          service:
            name: appv1
            port:
              number: 80
      - pathType: Prefix
        path: /test
        backend:
          service:
            name: appv1
            port:
              number: 80
  - host: whoami.od.com
    http:
      paths:
      - pathType: Prefix
        path: /whoami
        backend:
          service:
            name: whoami
            port:
              number: 80
注意:如果没有dns服务器解析会获取不到状态信息。通过修改coredns配置也可以实现。如果你的 blackbox-exporter 容器启动使用的hostnetwork 那么 pod 启动的机器上也要配置 hosts 解析
$ kubectl edit -n kube-system configmaps coredns
 Corefile: |
    .:53 {
        errors
        log
        health
        hosts {  # 添加 hosts 配置
            10.1.1.100 k8s-master whoami.od.com
            10.1.1.120 k8s-node1 whoami.od.com
            10.1.1.130 k8s-node2 whoami.od.com
            fallthrough
        }
3. rules 告警规则
apiVersion: monitoring.coreos.com/v1
kind: PrometheusRule
metadata:
  labels:
    app.kubernetes.io/name: kube-prometheus
    app.kubernetes.io/part-of: kube-prometheus
    prometheus: k8s
    role: alert-rules
    release: kube-prometheus-stack
  name: blackbox-exporter-alerts
  namespace: monitoring
spec:
  groups:
    - name: blackbox-exporter-alerts
      rules:
        ## 1. 探测失败
        - alert: 黑盒探测失败
          expr: probe_success == 0
          for: 1m
          labels:
            severity: critical
          annotations:
            summary: "黑盒探测失败:"
            description: "黑盒探测失败,目标为 。"

        ## 2. HTTP 状态码异常
        - alert: HTTP状态码异常
          expr: probe_http_status_code != 200
          for: 1m
          labels:
            severity: warning
          annotations:
            summary: "HTTP 状态码异常:"
            description: "HTTP 探测返回了非 200 的状态码,目标为 ,返回状态码 。"

        ## 3. 请求超时
        - alert: 黑盒探测请求超时
          expr: probe_duration_seconds > 10
          for: 1m
          labels:
            severity: warning
          annotations:
            summary: "探测请求超时:"
            description: "探测请求时间超过了 10 秒,目标为 。"

        ## 4. HTTP 响应时间告警(轻度)
        - alert: HTTP响应时间过长(轻度)
          expr: probe_duration_seconds > 3
          for: 5m
          labels:
            severity: warning
          annotations:
            summary: "HTTP 响应时间过长:"
            description: "HTTP 响应时间超过 3 秒,目标为 。"

        ## 5. HTTP 响应时间告警(严重)
        - alert: HTTP响应时间过长(严重)
          expr: probe_duration_seconds > 5
          for: 5m
          labels:
            severity: critical
          annotations:
            summary: "HTTP 响应时间严重过长:"
            description: "HTTP 响应时间超过 5 秒,目标为 。"

        ## 6. DNS 探测失败
        - alert: DNS探测失败
          expr: probe_dns_lookup_time_seconds == 0
          for: 1m
          labels:
            severity: critical
          annotations:
            summary: "DNS 探测失败:"
            description: "DNS 查询失败,目标为 。"

        ## 7. TCP 连接失败
        - alert: TCP连接失败
          expr: probe_tcp_connect_success == 0
          for: 1m
          labels:
            severity: critical
          annotations:
            summary: "TCP 连接失败:"
            description: "TCP 连接失败,目标为 。"

        ## 8. ICMP 探测失败
        - alert: ICMP探测失败
          expr: probe_icmp_success == 0
          for: 1m
          labels:
            severity: critical
          annotations:
            summary: "ICMP 探测失败:"
            description: "ICMP 探测失败,目标为 。"

        ## 9. DNS 响应时间过长
        - alert: DNS响应时间过长
          expr: probe_dns_lookup_time_seconds > 2
          for: 5m
          labels:
            severity: warning
          annotations:
            summary: "DNS 响应时间过长:"
            description: "DNS 响应时间超过 2 秒,目标为 。"

        ## 10. 网络抖动(Jitter)告警
        - alert: 网络抖动过高
          expr: probe_duration_seconds > avg_over_time(probe_duration_seconds[10m]) * 1.5
          for: 10m
          labels:
            severity: warning
          annotations:
            summary: "网络抖动过高:"
            description: "网络抖动异常,过去 10 分钟内目标为 。"

        ## 11. 网络丢包率过高
        - alert: 网络丢包率过高
          expr: (probe_icmp_duration_seconds / probe_duration_seconds) < 0.95
          for: 5m
          labels:
            severity: warning
          annotations:
            summary: "高丢包率:"
            description: "网络丢包率超过 5%,目标为 。"

        ## 12. TLS 证书即将过期
        - alert: TLS证书即将过期
          expr: probe_ssl_earliest_cert_expiry - time() < 86400 * 30
          for: 1h
          labels:
            severity: warning
          annotations:
            summary: "TLS 证书即将到期:"
            description: "TLS 证书将在 30 天内过期,目标为 。"

        ## 13. TLS 证书即将过期
        - alert: TLS证书即将过期
          expr: probe_ssl_earliest_cert_expiry - time() < 86400 * 15
          for: 1h
          labels:
            severity: warning
          annotations:
            summary: "TLS 证书即将到期:"
            description: "TLS 证书将在 15 天内过期,目标为 。"

        ## 13. TLS 证书即将过期
        - alert: TLS证书即将过期
          expr: probe_ssl_earliest_cert_expiry - time() < 86400 * 7
          for: 1h
          labels:
            severity: warning
          annotations:
            summary: "TLS 证书即将到期:"
            description: "TLS 证书将在 7 天内过期,目标为 。"
4. 自定义配置文件使用 POST 请求抓取特定接口内容
1. 编写一个测试服务
# 制作简单的 flask 应用

$ vim app.py
from flask import Flask, request, jsonify
import random

app = Flask(__name__)

# 定义一些可能的响应消息
responses = {
    "message1": "Hello, this is a random response 1!",
    "message2": "Wow, you got response number 2!",
    "message3": "Here's a third option for you.",
    # 可以添加更多消息...
}

@app.route('/api', methods=['POST'])
def post_request():
    # 从请求的 JSON 数据中提取信息(如果有的话)
    data = request.json
    # 这里可以添加逻辑来处理 data,但在这个例子中我们不需要它

    # 从 responses 字典中随机选择一个消息
    random_response = random.choice(list(responses.values()))

    # 构造响应字典
    response_dict = {
        "received_data": data if data else "No data received",
        "random_message": random_response
    }

    # 返回响应
    return jsonify(response_dict), 200

if __name__ == '__main__':
    print("Flask app is running. To send a POST request using curl, use the following command:")
    print("curl -X POST -H \"Content-Type: application/json\" -d '{\"some_key\":\"some_value\"}' http://localhost:5000/api")
    app.run(host='0.0.0.0', port=5000)
2. 编写 Dockerfile
$ cat Dockerfile

FROM python:3.8-slim

WORKDIR /app

RUN pip install flask

COPY ./app.py /app/app.py

EXPOSE 5000

CMD ["python", "app.py"]
$ docker build . -t flask-app:v1
3. 启动服务
cat deployment.yaml
apiVersion: apps/v1
kind: Deployment
metadata:
  name: flask-app-deployment
spec:
  replicas: 1
  selector:
    matchLabels:
      app: flask-app
  template:
    metadata:
      labels:
        app: flask-app
    spec:
      containers:
      - name: flask-app
        image: harbor.meta42.indc.vnet.com/library/flask-app:v2
        ports:
        - containerPort: 5000

---
apiVersion: v1
kind: Service
metadata:
  name: flask-app-service
  labels:
    app: flask-app
    #release: kube-prometheus-stack  # Prometheus Operator的release名称,使其kubernetes自动发现该ingress
  annotations:
    prometheus.io/http-probe: "true"           # 控制是否监测
    prometheus.io/http-probe-path: /api           # 控制监测路径
    prometheus.io/http-probe-port: "5000"        # 控制监测端口
spec:
  selector:
    app: flask-app
  ports:
    - protocol: TCP
      port: 5000
      targetPort: 5000
  type: NodePort

---
apiVersion: monitoring.coreos.com/v1
kind: ServiceMonitor
metadata:
  labels:
    release: kube-prometheus-stack
  name: blackbox-flask-app-service
  namespace: monitoring
spec:
  endpoints:
  - interval: 15s
    params:
      module:
      - http_2xx_flask
    path: /probe
    relabelings:
    - action: keep
      regex: "true"
      sourceLabels:
      - __meta_kubernetes_service_annotation_prometheus_io_http_probe
    - action: replace
      regex: (.+);(.+);(.+);(.+)
      replacement: $1.$2:$3$4
      sourceLabels:
      - __meta_kubernetes_service_name
      - __meta_kubernetes_namespace
      - __meta_kubernetes_service_annotation_prometheus_io_http_probe_port
      - __meta_kubernetes_service_annotation_prometheus_io_http_probe_path
      targetLabel: __param_target
    - action: replace
      replacement: blackbox-exporter.monitoring:19115
      targetLabel: __address__
    - action: replace
      sourceLabels:
      - __param_target
      targetLabel: instance
    - action: labelmap
      regex: __meta_kubernetes_service_label_(.+)
    - action: replace
      sourceLabels:
      - __meta_kubernetes_namespace
      targetLabel: serivce_namespace
    - action: replace
      sourceLabels:
      - __meta_kubernetes_service_name
      targetLabel: service_name
  namespaceSelector:
    matchNames:
    - default
  selector:
    matchLabels:
      app: flask-app
4. 修改配置文件新增自定义功能
$ kubectl edit cm -n monitoring blackbox-exporter-configuration

  http_2xx_flask:
    prober: http
    timeout: 5s
    http:
      valid_http_versions: ["HTTP/1.1", "HTTP/2.0"]
      valid_status_codes: [200]
      method: POST
      headers:
        Content-Type: application/json  # 设置内容类型为 JSON
      body: '{"key1": "value1", "key2": "value2"}'  # JSON 格式的请求体
      fail_if_body_not_matches_regexp:
        - "Hello, this is a random response"  # 验证响应体是否包含此关键字
七、CURL 调用 Prometheus API 接口
# 使用 container_memory_usage_bytes 获取容器内存使用情况
$ curl -s -G \
     --data-urlencode 'query=sum by (pod) (container_memory_usage_bytes{namespace="sreworks", pod=~"meta42-iot-server-sreworks-.*", container!="POD"}) / (1024 * 1024 * 1024)' \
     http://192.168.233.32:32090/api/v1/query | jq '.data.result[] | {pod: .metric.pod, memory_usage_gb: .value[1]}'

# 取 value 值并除以2(和 kubesphere 界面中监控值一样)
$ curl -s -G \
     --data-urlencode 'query=sum by (pod) (container_memory_usage_bytes{namespace="sreworks", pod=~"meta42-iot-server-sreworks-.*", container!="POD"}) / (1024 * 1024 * 1024)' \
     http://192.168.233.32:32090/api/v1/query | \
     jq '.data.result[] | {pod: .metric.pod, memory_usage: (.value[1] | tonumber / 2)}'
脚本自动获取 pod 内存使用情况并自动重启 pod 释放内存
$ vim check_pod_memory_usage.sh
#!/bin/bash

# Prometheus server URL
PROMETHEUS_URL="http://192.168.233.32:32090/api/v1/query"
# PromQL 查询语句,单位 GiB
QUERY='sum by (pod) (container_memory_usage_bytes{namespace="sreworks", pod=~"meta42-iot-server-sreworks-.*", container!="POD"}) / (1024 * 1024 * 1024)'

# Memory threshold in GiB
THRESHOLD=20

# 日志输出文件
LOG_FILE="/var/log/pod_memory_monitor.log"

# 日志输出函数
log() {
    local message="$1"
    local timestamp="$(date '+%Y-%m-%d %H:%M:%S')"
    echo "$timestamp - $message" | tee -a "$LOG_FILE"
}

# while 循环,每分钟检查一次
while true; do
    # 从 Prometheus 获取每个 Pod 的内存使用情况
    PODS_USAGE=$(curl -s -G --data-urlencode "query=$QUERY" "$PROMETHEUS_URL")

    # 输出调试信息
    log "Raw data from Prometheus:"
    echo "$PODS_USAGE" | jq .

    # 解析并处理数据
    echo "$PODS_USAGE" | jq -c '.data.result[]' | while read -r pod_usage; do
        POD=$(echo "$pod_usage" | jq -r '.metric.pod // empty')
        MEMORY_USAGE=$(echo "$pod_usage" | jq -r '.value[1] // empty' | awk '{printf "%d", $1 / 2}')

        # 确认 Pod 是否在 Kubernetes 中实际存在
        if ! kubectl get pod -n sreworks "$POD" &>/dev/null; then
            log "Pod $POD 不存在于 Kubernetes 中,跳过..."
            continue
        fi

        # 检查内存使用是否超过阈值
        if [ "$MEMORY_USAGE" -gt "$THRESHOLD" ]; then
            log "Pod $POD 内存使用超过 ${THRESHOLD}Gi,准备重启..."
            kubectl -n sreworks delete pod "$POD"

            # 等待 10 秒以便新 Pod 名称生成
            sleep 20

            # 查找新的 Pod 名称(通过比较 AGE 确认最新 Pod , .[-1].name 表示取最小时间,姑且原则上新启动的 pod)
            while true; do
                NEW_POD=$(kubectl get pod -n sreworks -l app.kubernetes.io/name=meta42-iot-server -o json | jq -r '.items[] | select(.metadata.deletionTimestamp == null) | {name: .metadata.name, age: .metadata.creationTimestamp}' | jq -s 'sort_by(.age) | .[-1].name' | tr -d '"')

                if [ -n "$NEW_POD" ] && [ "$NEW_POD" != "$POD" ]; then
                    log "新 Pod 名 $NEW_POD"
                    break
                fi
                sleep 5
            done

            # 等待新 Pod 状态为 Running 且容器状态为 Ready
            while true; do
                POD_STATUS=$(kubectl get pod -n sreworks "$NEW_POD" -o jsonpath='{.status.phase}')
                POD_READY=$(kubectl get pod -n sreworks "$NEW_POD" -o jsonpath='{.status.containerStatuses[0].ready}')

                if [ "$POD_STATUS" == "Running" ] && [ "$POD_READY" == "true" ]; then
                    log "Pod $NEW_POD 已重启并处于 Running 状态。"
                    break
                else
                    log "等待 $NEW_POD 重启完成..."
                    sleep 5
                fi
            done
        else
            log "Pod $POD 内存使用正常:${MEMORY_USAGE}Gi"
        fi
    done

    # 每分钟检查一次
    sleep 60
done